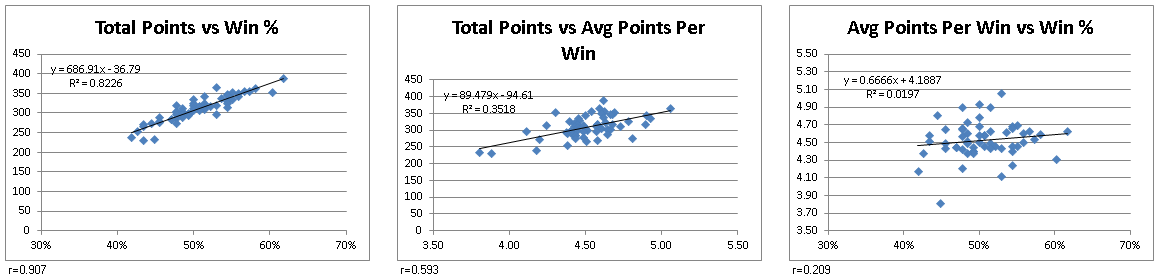
- x: win percentage (item 1)
- v: average points per win (item 2)
- y: total points
The correlation coefficient of x and y was .907 and the coefficient of v and y was .593. At N=58, both are statistically significant at the .001 level. That's not a surprise. But the takeaway is that the ability to pick match-ups correctly had a stronger relationship with overall performance than the ability to assign a confidence value to those picks. In addition, the correlation coefficient of x and v was .209, and therefore not statistically significant (a correlation of .45 is required at the .001 level).
For the second piece of analysis, I wanted to see whether individuals did better that could be attributed to simply picking teams to win at random. If you take a simplified view of how spreads are set by sports books, and assume that spreads are set so that there an equal number of people taking either side of the spread, picking against the spread becomes comparable to a coin flip. That is to say, picking a side should result in you being correct 50% of the time. As a result, determining whether one person's results were truly the result of being able to out-predict the sports books can be reduced to a test for the fairness of a coin.
In my pool, the winner correctly predicted the against-the-spread winner 61.7% of the time. The next closest person (who finished 6th) correctly predicted the winner 60.3% of the time. So now the question is, was this a result of being able to analyze the game better than the books, or was it just luck?
Taking a look at BL1, the pool winner, with a 61.7% prediction rate, I could make the following hypotheses:
- H0: Participant BL1 did not better than could be expected by randomly picking teams
- HA: Participant BL1 did better than could be expected by randomly picking teams
At a 95% confidence level, I would reject H0 if the prediction rate fell outside 1.96 standard deviations from the mean.
Calculating the z-score for the 61.7% prediction rate over 136 games was found by:
- z = (.617 - .5) / SQRT(.5 * .5 / 136)
- z = 2.74
So this would mean that the null hypothese should be rejected, and that participant BL1 had results that were better than picking randomly. The z-score for the participant with 60.3% prediction rate was 2.40, meaning that person also did better than could be expected by picking randomly.
For everyone else, who fell within the acceptance region of ±0.084, we would not reject the null hypotheses, and could claim there performance was no better than random luck.
I guess that would give me some statistical smack-talk for next year, except I also fell within that interval, with 54.4% accuracy in predictions, and a z-score of 1.03.